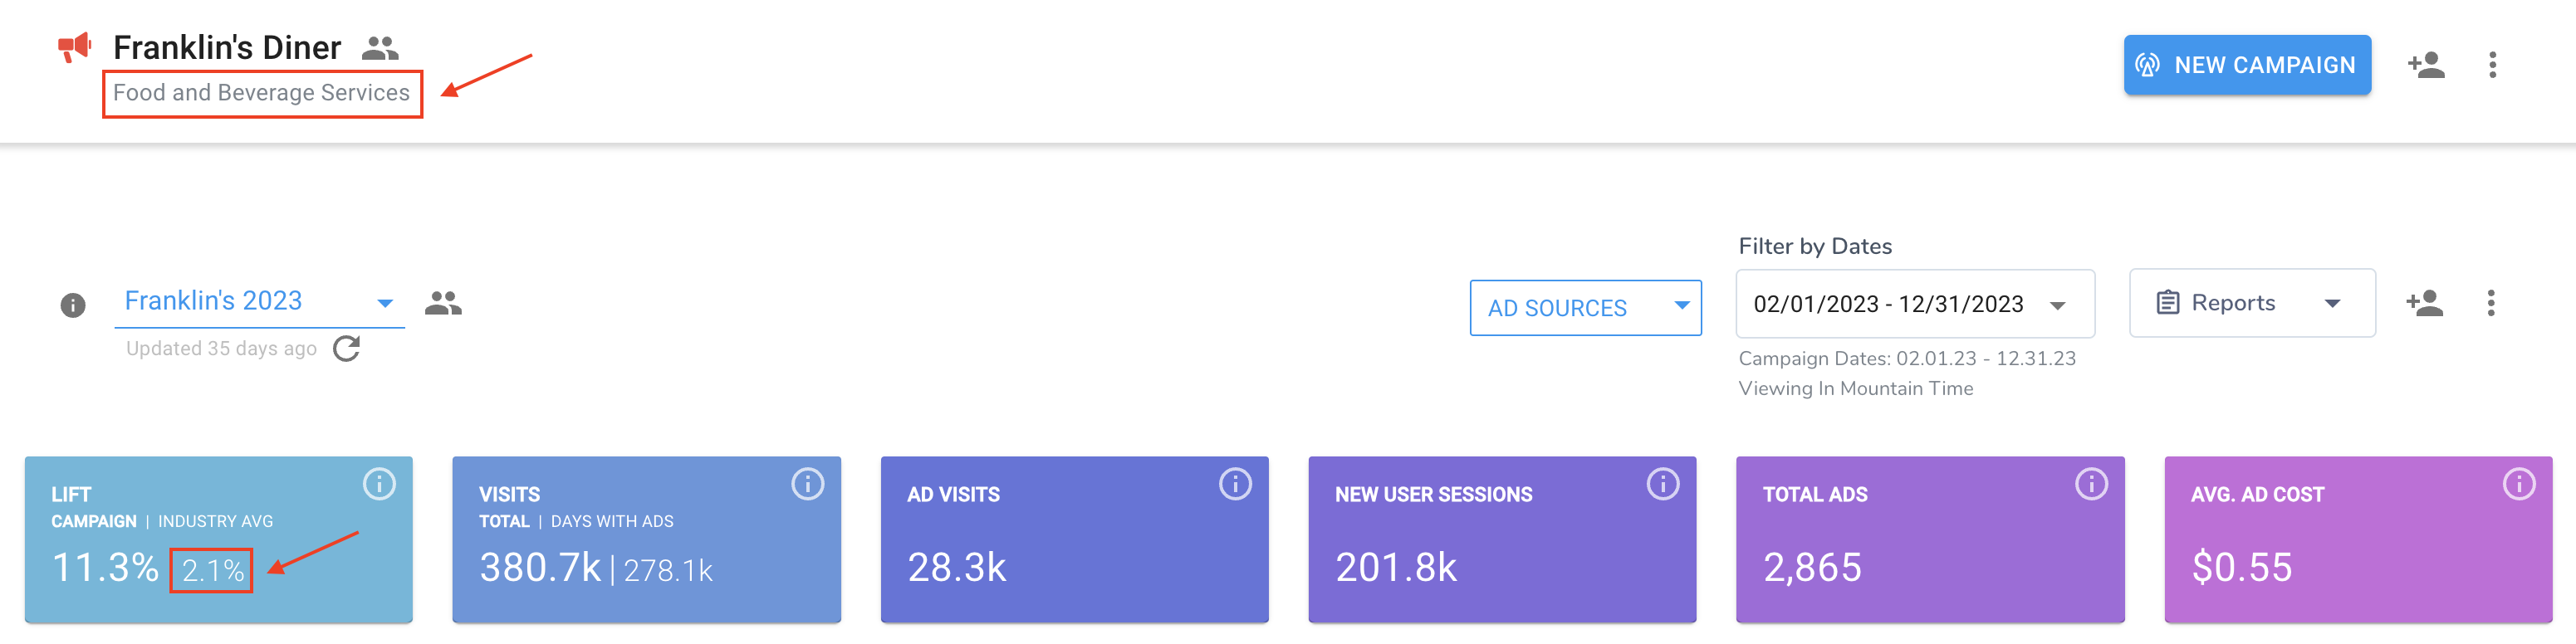
The industry average lift feature in your campaign dashboard offers valuable insights, enhancing the way you market to prospective clients and providing proof of performance metrics to current advertisers.
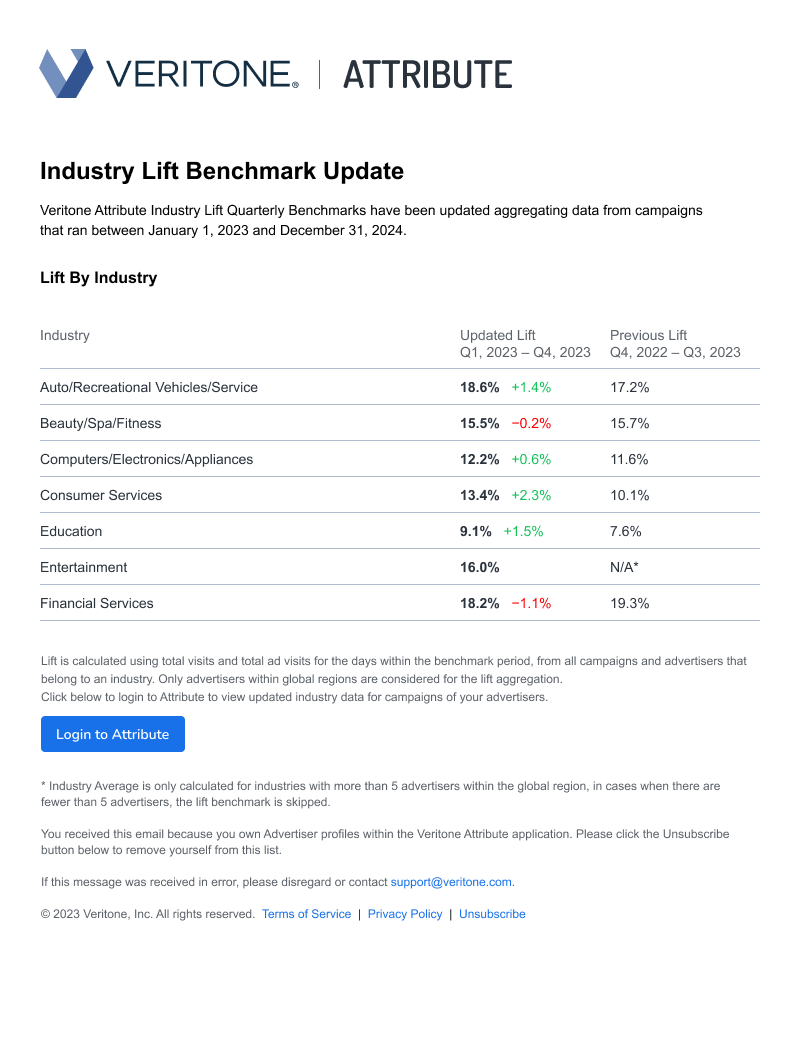
Industry lift is calculated using the total visits and ad visits for the days within the benchmark period, from all campaigns and advertisers that belong to the industry. Only advertisers within the global region are considered for the lift aggregation.
Use industry average lift to:
-
Get tailored industry insights: Leverage industry-specific benchmarks based on your global region (e.g., North America or United Kingdom/Europe) to gain a deeper understanding of campaign performance.
-
Offer persuasive proof for advertisers: Showcase benchmark lift data to prospective advertisers, demonstrating the effectiveness of campaigns within their industry and global region.
-
Align performance: Compare your advertiser campaign performance against industry lift benchmarks, empowering you to make data-driven decisions.
- Dynamically optimize campaigns: Identify opportunities for improvement by making informed suggestions and optimizations for campaigns that fall below industry benchmarks.
Where to see industry average lift
You can access industry average lift:
- In your campaign dashboard
- In quarterly email reports
Campaign dashboard
For enabled customer organizations, you'll see the industry under the campaign name, and the lift percentage as a second number in the Lift box.
Quarterly email reports
Users who have created any advertiser within the Attribute application will also receive an insightful quarterly email report, sharing key updates and insights regarding their global region's industry data. This report will be sent out on the 15th of every first month of the new quarter, also comparing this time period's average lift to the previous to identify key increases or decreases.
[Note]When unsubscribing to this email, the user will also be auto-unsubscribed from all Attribute emails such as advertiser email invite copies, reminders, etc.
Global region segmentation
All of Veritone's industry data is segmented by various global regions to ensure data relevancy. The regions are as below:
- North America
- South America
- Europe and United Kingdom
- Australia and New Zealand
- Asia
- Non-regional
Non-regional is an assignment to unique customer organizations in cases where, for example, they would like to calculate industry metrics based on their own organization's advertiser data only.
Exclude lift in a report download
We know sometimes the data included in your campaign dashboard needs to be strategically placed or edited to highlight optimal insights to your advertisers. As a result you'll notice a new way to add and remove the various Lift metrics within the Report Builder experience, specifically Step 2: Build Your Report. Dynamically remove or add your campaign lift and/or industry average lift by using the new trash can icon or plus sign icon in the Report Settings section to build your perfect report!
Troubleshooting
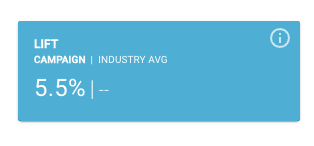
If you're not seeing your advertiser's industry average lift in the campaign dashboard or email report, we’re only able to calculate an industry average lift for industries with more than 5 advertisers within the global region to maintain data relevance. In cases where there are fewer than 5 advertisers, the lift benchmark is not calculated and skipped.
If skipped, the campaign dashboard will appear as:
In email reports, the industry is omitted.
Different or additional industry insights
We'd love your feedback on what data analytics are most relevant and useful to you! If you have any comments, questions, or ideas on how to improve this feature please contact your Customer Success Manager who can pass along this information to our Product Team.