Understanding your reports means you'll be better positioned to strategically adjust campaigns over time.
We use the following terms in reports:
| Lift | Shows the effect of attributable web visits during the campaign period. Lift is calculated by dividing the Ad Visits by Non-Ad Visits. Hover over the ‘i’ icon on the Lift top line metric to view the equation with your unique campaign data! Essentially, this is the percent of increase to an advertisers website based on the spots they are running. |
| Visits | Details the total number of site visits which occurred on your client’s website during the time frame selected. Next to that number, we will also see a metric here for the total visits on days when our ads were on air. So of the total visits this Advertiser website experienced during the selected date range, a certain subset of them are from days when ads were running. |
| Ad visits | Represents sessions as defined by Google Analytics. This refers to visits to the advertiser website that occur within the 8-10-minute attribution window. This is also synonymous with the term “Attributable Sessions.” |
| Total ads | The number of commercials that ran during your campaign, including any tracked spots or unlogged lives. We track this by how you’ve set up your searches in Step 3: Find Ads during campaign creation. |
| Average ad cost | Represents the average cost of commercials for the metric you are viewing. Example, the Ad Cost for Morning Drive is the cost of all commercials in that daypart divided by the number of spots. Keep in mind that any low charge or no charge commercials will lower your average rate. This data is needed to help your client understand the efficiency of dayparts, ads, days of week, etc. when compared with Ad Visits per spot. This metric will only appear in your dashboard if you are sharing that information with Veritone in your traffic logs. |
| Attribute | A directionally-based attribution tool you can use to provide clients with ROI metrics on their spend based on Web Lift Correlation. Use the reporting tabs to define each Metric to help you present them to the customer. |
Reporting tabs
WEB tab
Use the WEB tab to view a client’s overall web traffic trends according to their Google Analytics reported activity, during, before, or after a campaign. Toggle on the Compare Date Range setting on the first Web graph to compare on air periods to off air periods, essentially establishing a baseline of web activity to demonstrate your campaign’s effect on web traffic trends. In order to accurately compare data trends, you should also keep the time period duration being compared 1:1. In other words, if you are looking at a 2 week span during the on air Campaign period, you should update the comparable, inactive (or off air) period to a 2 week span as well. You can customize the dates being compared to determine the best and most accurate depiction of lift.
While this will default to show 30 days prior to your campaign start date, we recommend you adjust this date to select a time period that can reasonably reflect when your client was not actually running ads at all; the idea is to establish a baseline comparison.
Web data visualized in the graph is broken out in more granular detail in the associated table below.
[Note]You can view this data through different data cuts by selecting the drop downs shown, by Total Visits or by Ad Visits. Keep in mind when viewing the graph through the Ad Visits data cut, you should not be using the Compare Dates feature.
The two smaller visualizations on this page further break down the web data comparisons available. First, the Time of Day graph displays a heat map of when an on air ad performed the best via Ad Visits. Second, the Total Change graph shows us the daily average web visits on days when ads are running (daily avg. visits with ads), compared against the daily average visits on days without ads running (daily avg. visits without ads). We get the final percentage number by dividing the total change divided by daily avg. visits without ads. The total change is calculated by subtracting the daily avg. visits with ads and daily avg. visits without ads.
DAYPART tab
The DAYPART tab shows how ads map against a client’s attributable and non-attributable website traffic. Optimize your current or future campaigns by viewing Ad Visits by Daypart, Hour, Day of the Week, or Date and determine where ads performed the best. Optimized campaigns will show a strong correlation - represented by the pink overlay representing ads shown here - between when ads ran and when visits occurred. Utilize the associated drop-down menus to switch between different data cuts and/or the various reporting views (by daypart, by hour, by day of week, or by date). You can also adjust the visit and ad data included by selecting or deselecting Non-Ad Visits, Ad Visits, and/or Ads to build the most effective story for your reporting.
This data visualized in the graph is broken out in more granular detail in the associated table. The table will dynamically update based on the data cuts selection in the graph.
PLACEMENT tab
Surface top performing ad types for mid or post-campaign optimizations in the PLACEMENT tab. In this tab you can view all elements of your campaign, including pre-recorded spots and non-logged or unplanned lives, or stack up to drive traffic during the campaign period. You can only see native live mentions broken out on this tab if your campaign includes this type of placement and the Live Reads search was set up during campaign creation.
You can also gain better visibility into the relationship between all ads and mentions on a station by station level. Analyze performance by referencing Ad Visits per Ads in the data table to identify underperforming stations and optimize accordingly.
CREATIVE tab
The CREATIVE tab is where you can see a break out of all creative running during a campaign. Like on the other tabs we reviewed so far, you can view this data through different data cuts - such as by Creative or by Duration as shown in the drop down. Evaluate creative performance based on type, duration, the number of ads run, and creative messaging.
[Tip]Use the Ad Visits per Ad metric in the associated data table to optimize your campaign by identifying the creative that drives the best attributable web traffic.
LOCATIONS tab
Location data is not available with GA4 at the moment. Please contact your Customer Success Manager or Support@veritone.com for more information.
CHANNELS tab
Channel data is not available with GA4 at the moment. Please contact your Customer Success Manager or Support@veritone.com for more information.
DEVICE CATEGORY tab
DEVICE CATEGORY displays a visualization and data table of which device was utilized during the web session, building a better visitor profile to understand how/when audience members are reaching the website.
PAGE PATH tab
PAGE PATH display a visualization and data table of which pages web users browsed during the attributable session. This helps users track exact attributable traffic for websites using specific landing pages associated with the campaign. For all others, understand how users are navigating the website including visitations to specific subpages which may be associated with the campaign or identifying areas to utilize in the campaign.
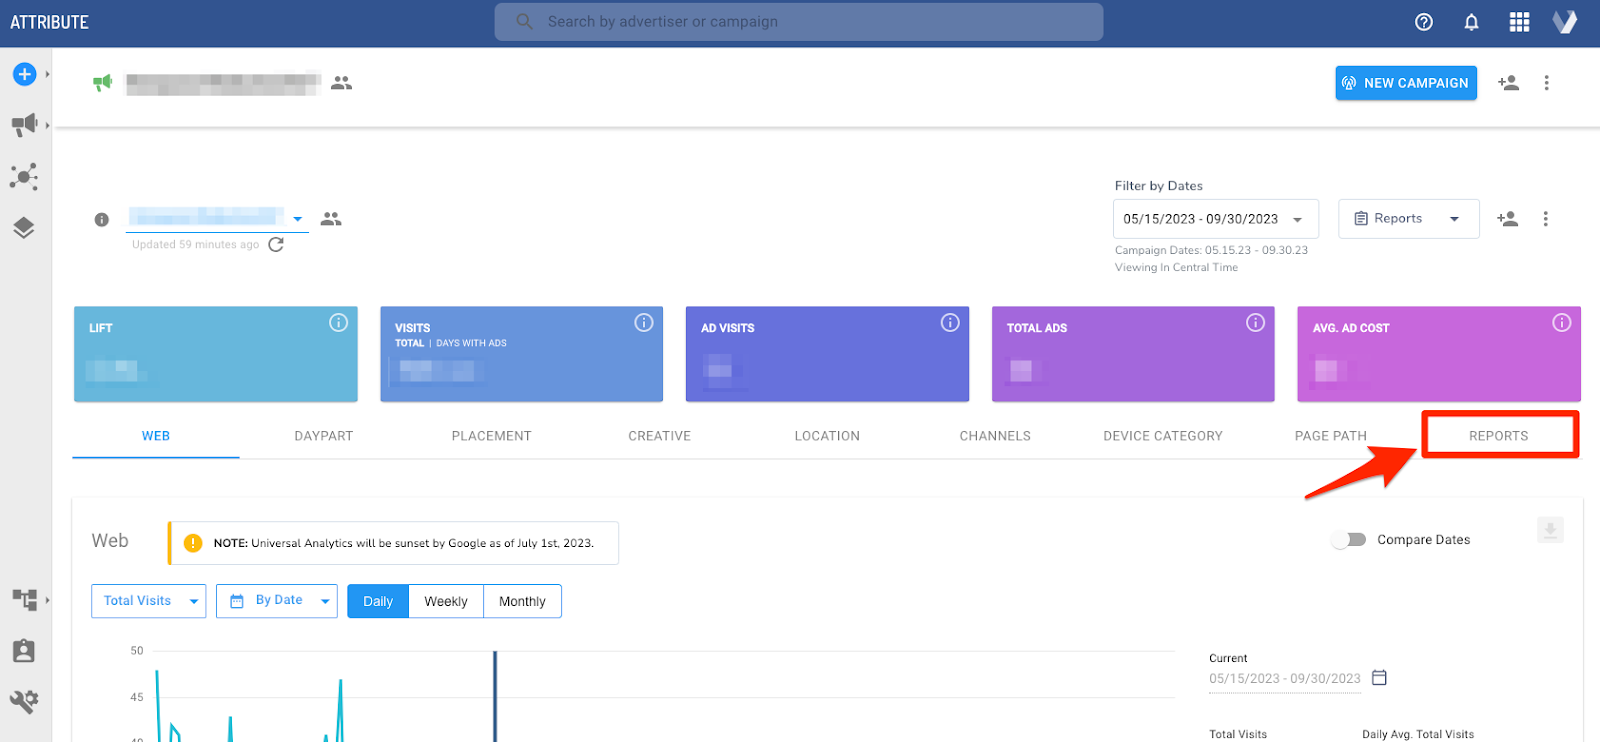
REPORTS tab
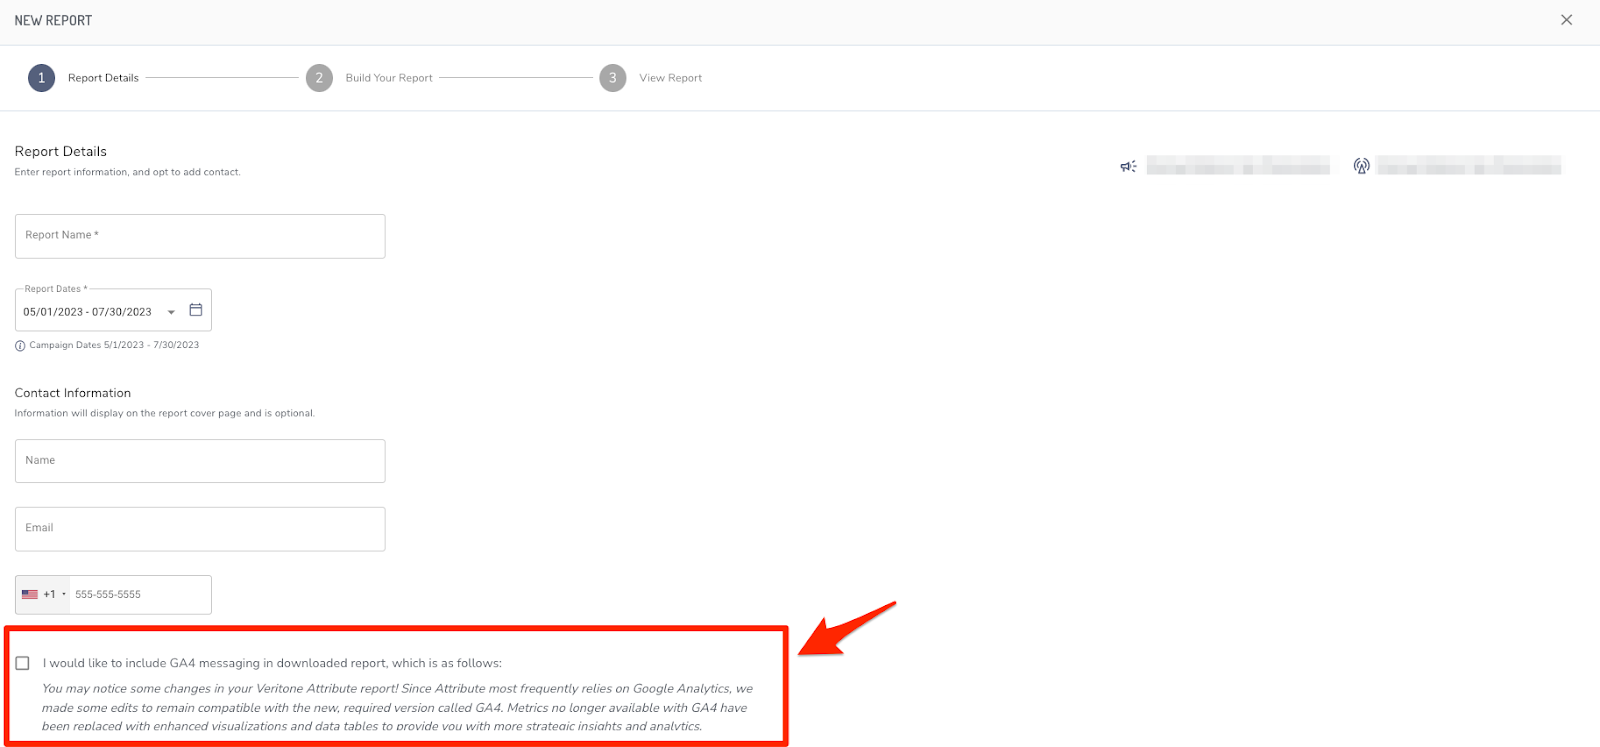
On the REPORTS tab, you can pull a report of data to share internally or with your clients. You can customize your report by leveraging the side panel to enter personal details. To export your report, click on the Download button at the bottom of the page and select a format to export locally to your computer.
When using the Report Builder tool, the first Report Details step now has a disclaimer available for use. Click the check-box next to the disclaimer information to include this blurb in your downloaded report to assist with educating users and Advertisers about the changes.